Crystallographic Texture and Orientations
For polycrystalline materials, each grain has a crystallographic texture and orientations that may or may not be different from neighboring grains.
Grain orientation may be randomly distributed or can be clustered about some particular direction. A polycrystalline material that contains grains oriented in a particular direction is considered to have a preferred orientation or texture.
The importance of preferred orientation in the industry lies in the effect which it has on the material properties. Material properties, including strength, corrosion properties, radiation damage, and magnetic properties, can be dramatically altered by preferred orientation.
Material property changes due to preferred orientation can be undesirable, such as in the deep drawing of sheet and wire, or beneficial, such as in transformer cores where texturing provides improved magnetic properties. Texturing is measured and controlled in many industrial applications, including the manufacture of metal wire, tubing and sheet, castings, and thin films.
How is it Measured?
Crystallographic texture and orientations can be quantitatively determined by X-ray diffraction. Through the use of a diffractometer and specialized sample holder, the preferred orientation of a specific set of crystallographic planes can be determined. Diffracted X-ray intensities are collected over a range of sample orientations, which are then used to describe the orientation of the crystals.
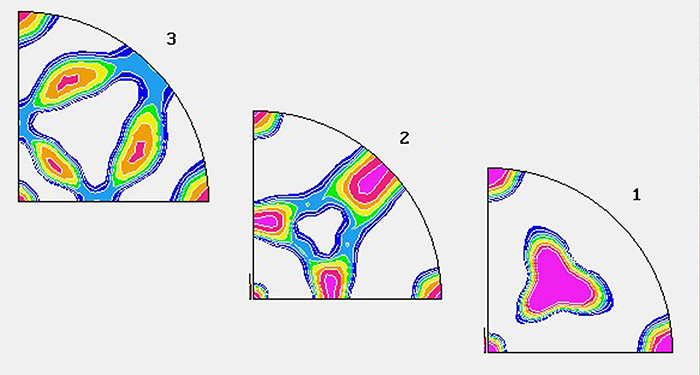
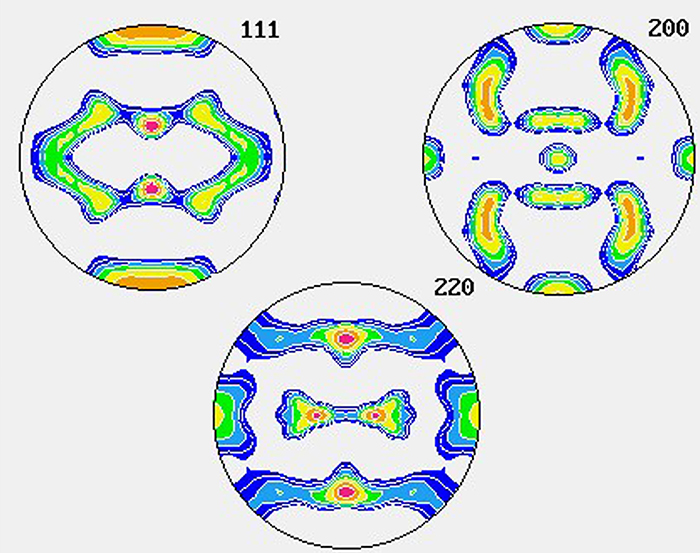
Preferred orientation results are described by means of a pole figure. A pole figure is a stereographic projection that shows the variation in pole density with orientation for a set of crystallographic planes. The pole figure often will be shown with a reference direction that corresponds to the orientation of the sample being tested, such as the rolling direction.
If a complete texture analysis is not needed, orientation ratios can be performed to provide useful texture information. Orientation ratios allow the integrated peak intensities from a diffraction pattern to be compared to the peak intensities of what a randomly oriented specimen would produce. These data provide information as to the degree of preferred orientation present for particular crystallographic planes lying parallel to the specimen surface. Unlike a pole figure, orientation ratios will not distinguish directionality within the surface but still provide useful information at a lower cost than a complete texture analysis.


XRD Texture Measurement Features:
- Schulz back-reflection pole figures using equal area data collection nets for optimum efficiency at spacings tailored to the application.
- Multiple pole figures obtained for selected (hkl) without sample remounting.
- Data presentation in either a true times random or normalized format.
- Corrections for specimen transparency, allowing accurate texture measurement in thin films.
- Orientation Distribution Function (ODF) analysis using popLA software and data file distribution to clients in popLA format.
- ODF analysis is provided by either the harmonic or WIMV (Williams-Imhof-Matthies-Vinel) methods.
- Ability to calculate inverse and direct pole figures from ODF
- Film techniques for direct calculation of fiber textures.
- Complete machine shop sectioning support for sample preparation.
- Facilities and techniques for tube thinning and elastic mounting for texture measurement in tubular specimens.
Application Examples:
- Monitoring crystallographic texture in zirconium and hafnium alloy nuclear fuel tubing.
- Texture development studies and quality control monitoring of texture in sputtering targets for a wide range of materials.
- Quantifying textures developed by a wide variety of extrusion, drawing, casting, rolling, and coating processes.
How are Lambda’s XRD services superior?
Our engineers have extensive experience determining the crystallographic “texture,” or preferred crystallite orientations, in a wide variety of materials and forms.
Much of the instrumentation and virtually all of the data collection software have been developed in our laboratory to meet the specific specimens and testing requirements of our clients. Data presentation ranges from peak ratio monitoring for quality control to full ODF analysis and recalculation of direct pole figures, inverse pole figures, and texture fibers.
We have developed software for both data acquisition and reduction, which provides a uniform resolution of data collection on an equal area spherical net. Most commercial pole figure software utilizes fixed equal angular increment data collection (usually 5 deg.), leading to high resolution at the center and lower resolution at the edges of the pole figure. Our software spaces the data points evenly throughout the entire pole figure. Further, the pole figure resolution can be adjusted to provide high resolution when required or lower resolution for high-speed data collection and reduced cost.
Through complete control of the data collection and reduction software, we offer texture studies and data presentations, providing the highest accuracy and testing efficiency possible.
Questions about our testing parameters or techniques?
Related Articles:
Lambda Research Diffraction Notes, No. 6, “Pole Figure Determination”
Lambda Research Diffraction Notes, No. 14, “Analysis of Radially Symmetric Textures Using Partial Pole Figures”

